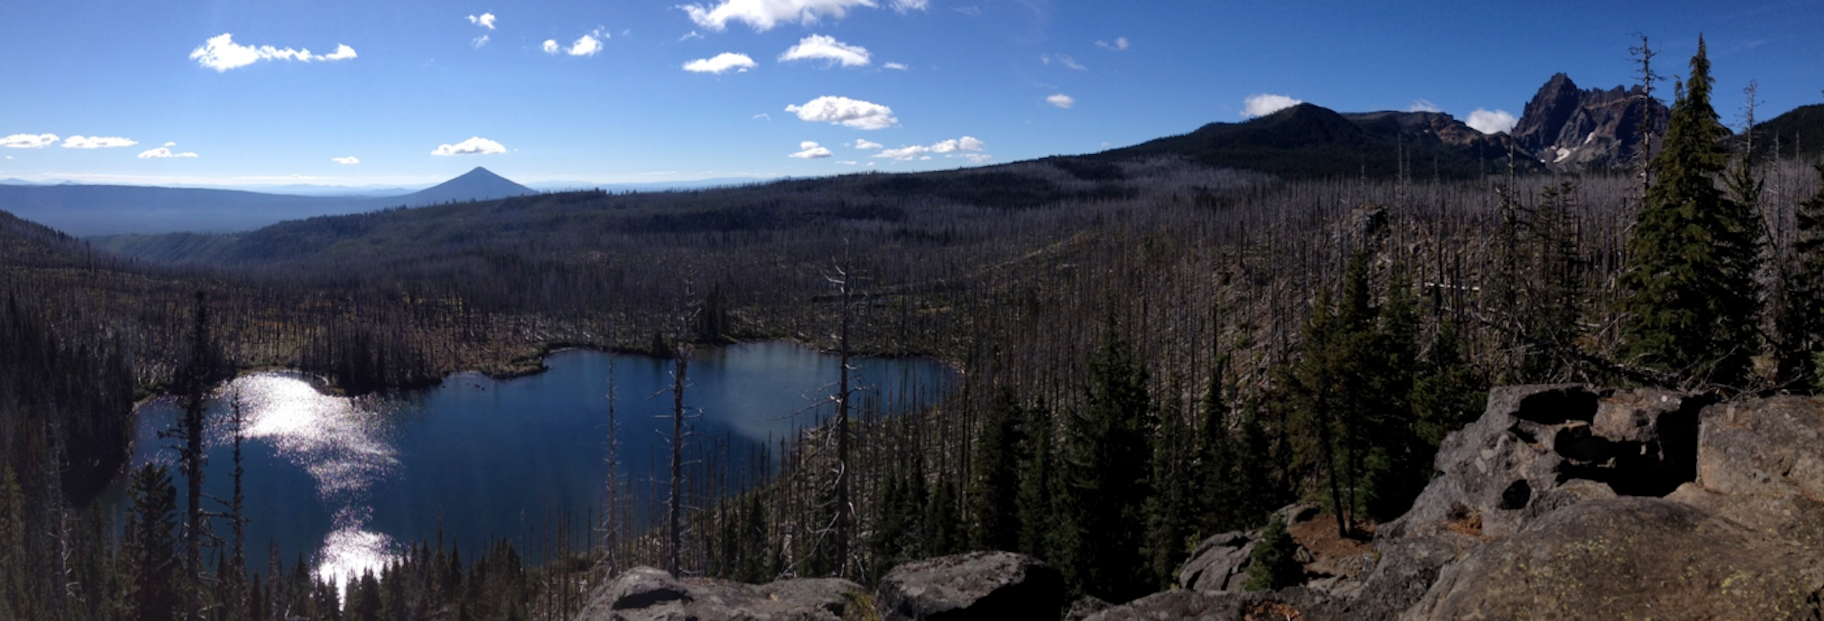
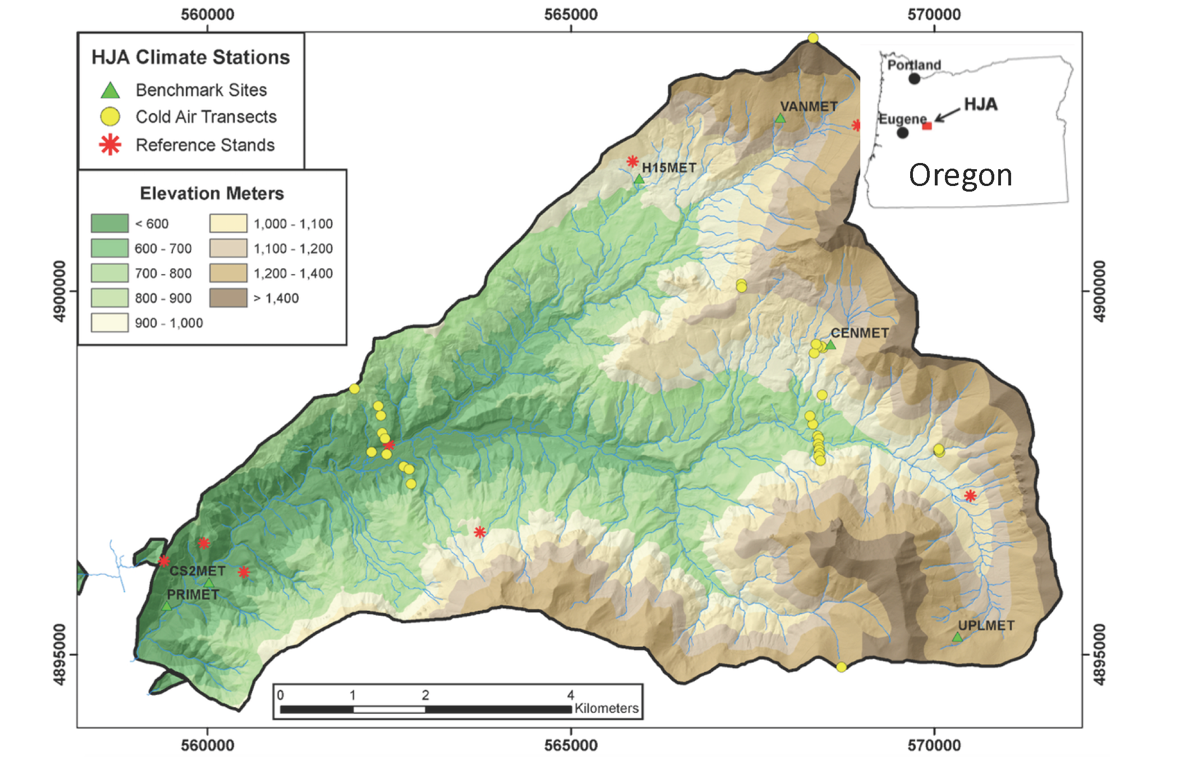
Cold Air Drainage and Pooling in the H. J. Andrews Experimental Forest
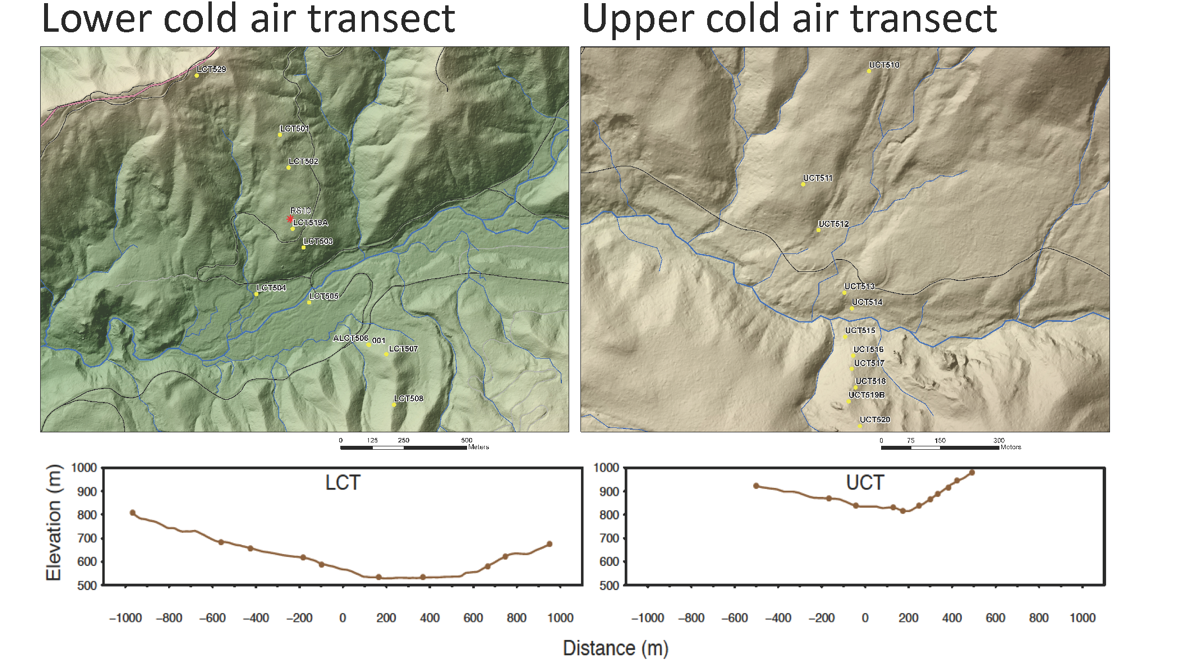
Animations of hourly temperature measured along the lower (LCT) and upper (UCT) cold-air transects
Hey, read this first! Animations with controls (forward, reverse, pause, faster, slower) are most easily viewed when Adobe Acrobat is set to be your browser's default pdf viewer. If you use Chrome, you will have to download the files first. Sorry, it is Google's doing, not mine.
Hey, read this, too! Some sensors have long data gaps (even more than a year), especially prior to 2008. Don't be discouraged if at first you don't see any temperature data. 2012 is good year to start with because it has little missing data.
2018
Time series (3 days per frame) with diagnostic meteorological variables
LCT south-facing | LCT north-facing | UCT south-facing | UCT north-facing
Elevation vs. temperature, all transects, with diagnostic meteorological variables
Jan-Mar | Apr-Jun | Jul-Sep | Oct-Dec
2017
Time series (3 days per frame) with diagnostic meteorological variables
LCT south-facing | LCT north-facing | UCT south-facing | UCT north-facing
Elevation vs. temperature, all transects, with diagnostic meteorological variables
Jan-Mar | Apr-Jun | Jul-Sep | Oct-Dec
2016
Time series (3 days per frame) with diagnostic meteorological variables
LCT south-facing | LCT north-facing | UCT south-facing | UCT north-facing
Elevation vs. temperature, all transects, with diagnostic meteorological variables
Jan-Mar | Apr-Jun | Jul-Sep | Oct-Dec
2015
Time series (3 days per frame) with diagnostic meteorological variables
LCT south-facing | LCT north-facing | UCT south-facing | UCT north-facing
Elevation vs. temperature, all transects, with diagnostic meteorological variables
Jan-Mar | Apr-Jun | Jul-Sep | Oct-Dec
2014
Time series (3 days per frame) with diagnostic meteorological variables
LCT south-facing | LCT north-facing | UCT south-facing | UCT north-facing
Elevation vs. temperature, all transects, with diagnostic meteorological variables
Jan-Mar | Apr-Jun | Jul-Sep | Oct-Dec
2013
Time series (3 days per frame) with diagnostic meteorological variables
LCT south-facing | LCT north-facing | UCT south-facing | UCT north-facing
Elevation vs. temperature, all transects, with diagnostic meteorological variables
Jan-Mar | Apr-Jun | Jul-Sep | Oct-Dec
2012
Time series (3 days per frame) with diagnostic meteorological variables
LCT south-facing | LCT north-facing | UCT south-facing | UCT north-facing
Elevation vs. temperature, all transects, with diagnostic meteorological variables
Jan-Mar | Apr-Jun | Jul-Sep | Oct-Dec
2011
Time series (3 days per frame) with diagnostic meteorological variables
LCT south-facing | LCT north-facing | UCT south-facing | UCT north-facing
Elevation vs. temperature, all transects, with diagnostic meteorological variables
Jan-Mar | Apr-Jun | Jul-Sep | Oct-Dec
2010
Time series (3 days per frame) with diagnostic meteorological variables
LCT south-facing | LCT north-facing | UCT south-facing | UCT north-facing
Elevation vs. temperature, all transects, with diagnostic meteorological variables
Jan-Mar | Apr-Jun | Jul-Sep | Oct-Dec
2009
Time series (3 days per frame) with diagnostic meteorological variables
LCT south-facing | LCT north-facing | UCT south-facing | UCT north-facing
Elevation vs. temperature, all transects, with diagnostic meteorological variables
Jan-Mar | Apr-Jun | Jul-Sep | Oct-Dec
2008
Time series (3 days per frame) with diagnostic meteorological variables
LCT south-facing | LCT north-facing | UCT south-facing | UCT north-facing
Elevation vs. temperature, all transects, with diagnostic meteorological variables
Jan-Mar | Apr-Jun | Jul-Sep | Oct-Dec
2007
Time series (3 days per frame) with diagnostic meteorological variables
LCT south-facing | LCT north-facing | UCT south-facing | UCT north-facing
Elevation vs. temperature, all transects, with diagnostic meteorological variables
Jan-Mar | Apr-Jun | Jul-Sep | Oct-Dec
2006
Time series (3 days per frame) with diagnostic meteorological variables
LCT south-facing | LCT north-facing | UCT south-facing | UCT north-facing
Elevation vs. temperature, all transects, with diagnostic meteorological variables
Jan-Mar | Apr-Jun | Jul-Sep | Oct-Dec
2005
Time series (3 days per frame) with diagnostic meteorological variables
LCT south-facing | LCT north-facing | UCT south-facing | UCT north-facing
Elevation vs. temperature, all transects, with diagnostic meteorological variables
HOW TO CITE THESE DATA
Rupp, D. E., Shafer, S. L., Daly, C., Jones, J. A., & Frey, S. J. K. (2020) Temperature gradients and inversions in a forested Cascade Range basin: Data release. Zenodo. https://doi.org/10.5281/zenodo.4266589
Users of this dataset should also cite
Rupp, D. E., Shafer, S. L., Daly, C., Jones, J. A., & Frey, S. J. K. (2020). Temperature gradients and inversions in a forested Cascade Range basin: Synoptic- to local-scale controls. J. Geophys. Res. Atmos. x(x). xx-xx. https://doi.org/10.1029/2020JD032686
and acknowledge the original data sources cited therein.
These graphics were made with R and animated using the 'animations' package.
Last updated 2020-11-12
![]()